2026 Charleston Residential Real Estate Market Report: Q1 Analysis and Inventory Trends
This report synthesizes sales performance from January through March 2026—representing "trailing" demand—against a "snapshot" of active inventory as of April 12, 2026.

1. Market Overview and Key Indicators
The Charleston residential real estate market through the first quarter of 2026 remains characterized by persistent scarcity and a clear advantage for sellers. This report synthesizes sales performance from January through March 2026—representing "trailing" demand—against a "snapshot" of active inventory as of April 12, 2026.
As a local market expert, I rely on the "Months of Inventory" metric to gauge market temperature. This figure estimates how long it would take for the current supply to be exhausted at the recent sales pace. In a healthy, balanced market, 6 months of inventory is the benchmark for equilibrium. Anything below this threshold signals a seller's market, while anything above favors the buyer.
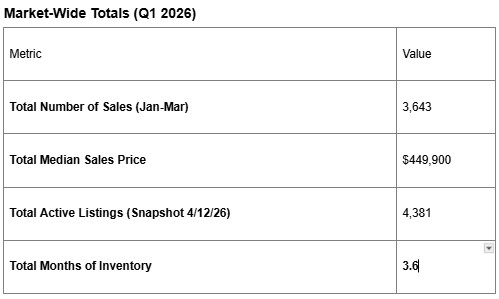
With a market-wide average of 3.6 months, Charleston continues to defy the return to a balanced state. While individual sub-markets show variance, the region as a whole remains supply-starved, sitting well below the 6-month threshold.
2. The "Hottest" Sub-Markets: Lowest Inventory Areas
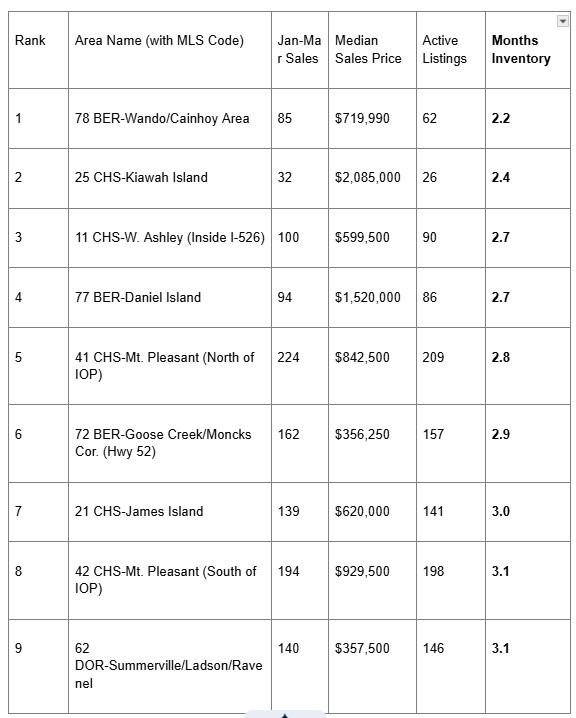
In the current landscape, these five areas are the "critical battlegrounds" for buyers. High demand in growth corridors and exclusive coastal enclaves has pushed inventory to extreme lows, resulting in some of the most seller-favorable conditions in the state.
- BER-Wando/Cainhoy Area (78)
- Median Sales Price: $719,990
- Months of Inventory: 2.2
- CHS-Kiawah Island (25)
- Median Sales Price: $2,085,000
- Months of Inventory: 2.4
- CHS-W. Ashley (Inside I-526 to Ashley River) (11)
- Median Sales Price: $599,500
- Months of Inventory: 2.7
- BER-Daniel Island (77)
- Median Sales Price: $1,520,000
- Months of Inventory: 2.7
- CHS-Mt. Pleasant (North of IOP Connector) (41)
- Median Sales Price: $842,500
- Months of Inventory: 2.8
The data underscores the BER-Wando/Cainhoy Area as the most competitive segment in Charleston. As a high-growth development corridor, its 2.2 months of supply indicates that new construction is simply not keeping pace with the influx of residents.
3. High-Value and Luxury Market Analysis
A common misconception in real estate is that luxury properties sit on the market longer. Our current data suggests otherwise, particularly on Kiawah Island.
Luxury Market Comparison: Scarcity at the Top
- CHS-Sullivan's Island (43): Commands the region's highest median sales price at $5,025,000. With 6.9 months of inventory, this ultra-exclusive enclave is one of the few areas currently favoring buyers with more time for selection.
- CHS-Isle of Palms (44): A premier resort destination with a median price of $2,197,500. It sits at 5.3 months of inventory, hovering just below market equilibrium.
- CHS-Kiawah Island (25): The primary anomaly in the luxury segment. Despite a $2,085,000 median entry point, inventory is a razor-thin 2.4 months.
Expert Insight: High price does not equal high inventory in Charleston's current luxury landscape. While Sullivan's Island offers some breathing room, Kiawah Island is experiencing demand levels usually reserved for entry-level suburban neighborhoods.
4. Regional Market Performance: Berkeley, Charleston, and Dorchester
Berkeley (BER)
Berkeley County is the region’s engine for volume. The Jedburg Rd/Black Tom corridor (74) is a massive growth leader with 571 sales in Q1. While this area provides critical supply, the inventory remains tight at 3.1 months. The real pressure point is Wando/Cainhoy, where supply has essentially vanished compared to the rate of sale.
Charleston (CHS)
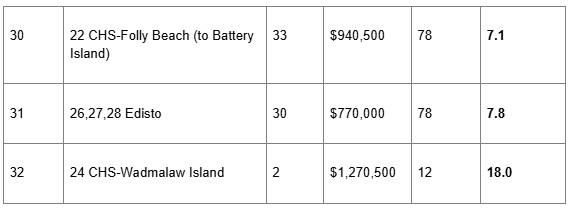
This region showcases the most diversity, from the high-demand "Inside I-526" West Ashley and Daniel Island sectors (under 3 months) to the barrier islands. Conversely, Wadmalaw Island (18.0 months) stands as the rural outlier. This area, known for large lots and a slower pace of life, is the only sub-market offering significant buyer leverage.
Dorchester (DOR)
Dorchester County has found its "affordability sweet spot" in the 350k–385k range. This consistency across Summerville and Ladson has created a steady, predictable demand. With inventory levels between 3.1 and 3.9 months, this region remains the primary target for the regional workforce.
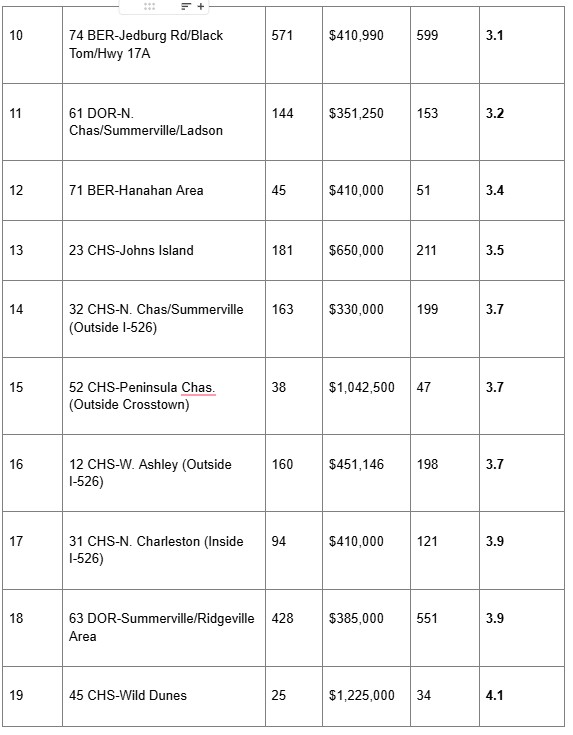
5. Supply vs. Demand Data Summary
The following table provides the definitive ranking of all 32 areas, highlighting the intense pressure on the suburban core.
6. Market Equilibrium Analysis
True balance in the 2026 market is currently a "coastal and resort" phenomenon. Areas reaching or exceeding the 6-month threshold offer a rare window for buyers to negotiate without the pressure of multi-offer scenarios.
- The Balanced Zone (5.1 – 7.8 Months): This includes St. George/Harleyville, Isle of Palms, Seabrook Island, Awendaw, Sullivan’s Island, Folly Beach, and Edisto. These are primarily second-home or luxury resort markets where transaction volume is naturally more deliberate.
- The Rural Outlier: CHS-Wadmalaw Island (18.0 months) remains the market's greatest anomaly. With only 2 sales in the first quarter against 12 active listings, this area signifies a heavy buyer's market. On Wadmalaw, the large-lot, rural nature of the properties leads to a significantly longer "days on market" expectation compared to the suburban core.
7. Conclusion: Strategic Takeaways for 2026
While the broader headlines might suggest a cooling national market, Charleston’s fundamentals remain rooted in a seller-favored posture (3.6 months). The shift toward equilibrium is happening exclusively in the high-end coastal and rural fringes, while the primary residential corridors are tightening.
Expert Insights
- The New Floor: The $400k barrier is the new floor for the suburban core. Areas falling within the 350k–450k range—specifically Berkeley’s Hwy 52 corridor and Dorchester’s Summerville/Ladson area—are seeing the highest velocity and will continue to drive market-wide price appreciation.
- The Inventory Crisis Point: Buyers targeting Wando/Cainhoy, Kiawah, or West Ashley (Inside I-526) must be prepared for extreme competition. In these areas, the inventory under 3 months means well-priced homes are likely sold before they hit the open market.
- Growth Engines: Developers and investors should look to the Jedburg Rd and Summerville/Ridgeville corridors. These two zones accounted for nearly 1,000 sales in Q1 alone, proving that Charleston’s residential expansion is moving decisively toward the northwest.# 2026 Charleston Residential Real Estate Market Report: Q1 Analysis and Inventory Trends
Photo Gallery