North vs. South Mount Pleasant: A Tale of Two Markets in 2026
The January 2026 market numbers reveal a fascinating shift.

When it comes to Mount Pleasant real estate, the IOP Connector has always served as the unofficial dividing line between two distinct submarkets. Historically, "South" Mount Pleasant (Area 42) was characterized by established neighborhoods and proximity to downtown Charleston, while "North" Mount Pleasant (Area 41) offered newer construction and slightly more attainable pricing.
However, the January 2026 market numbers reveal a fascinating shift. The price gap has all but vanished, and buyer intensity has moved decisively north. Here is how the two sides of town stacked up to kick off the year.
The Price Parity: A Virtual Tie
For years, buyers expected a premium for homes South of the Connector. In early 2026, that premium has effectively evaporated. Both areas experienced a nearly identical, minor price correction compared to January 2025, bringing them into a statistical tie.
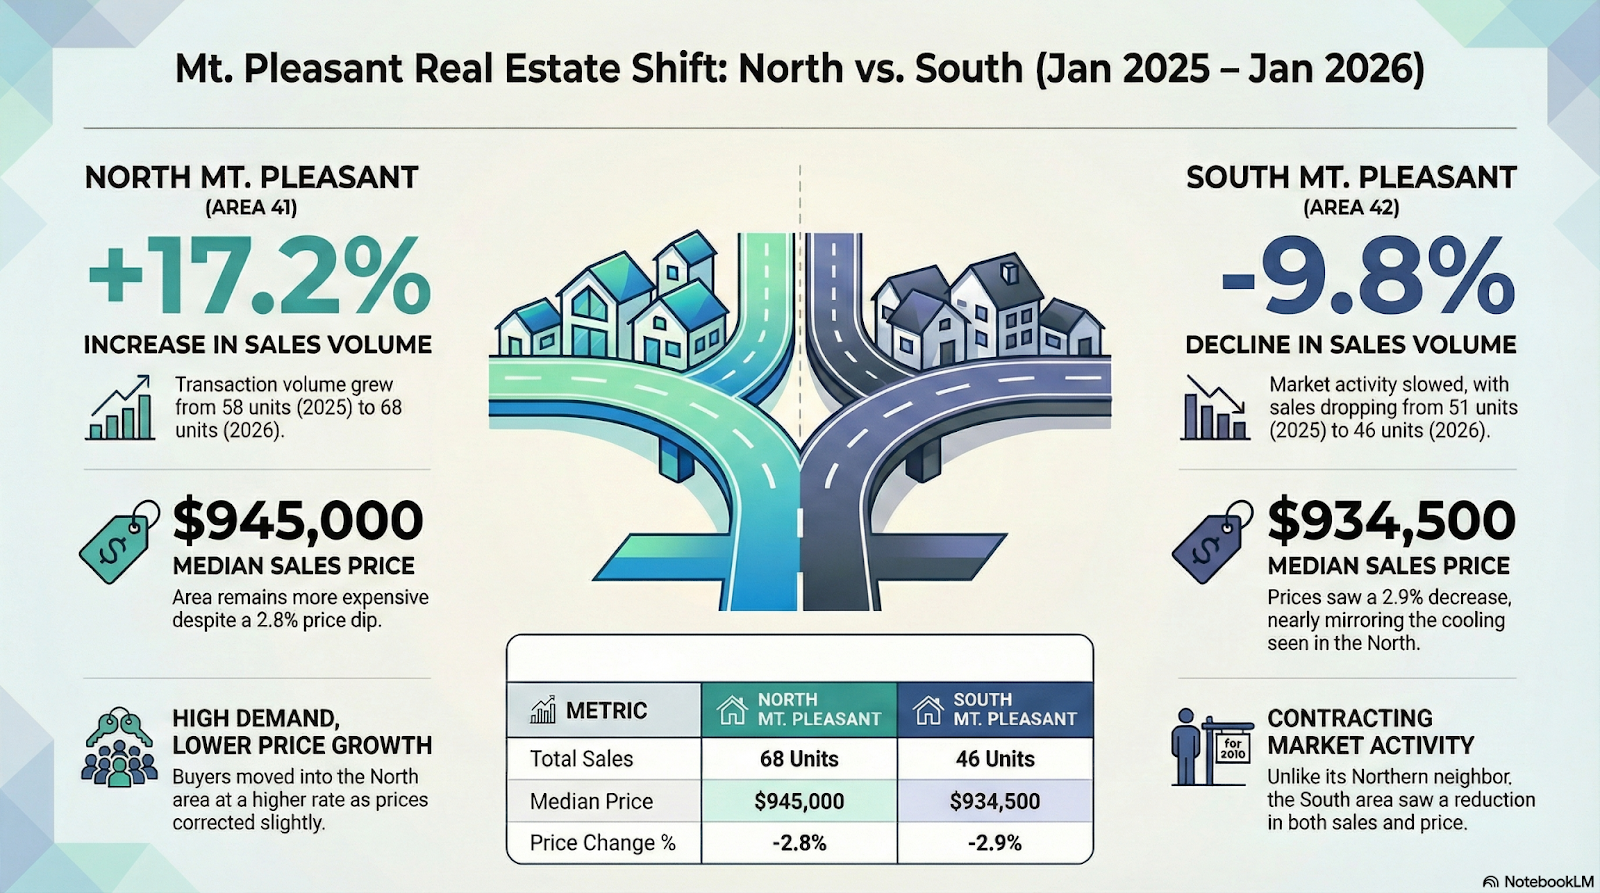
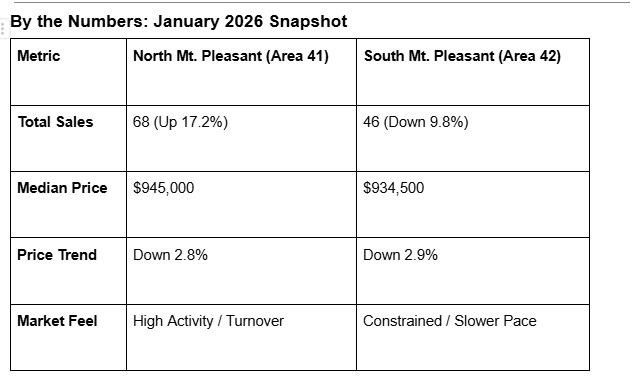
- North Mount Pleasant (Area 41): The median sales price settled at $945,000 (a 2.8% dip from last year).
- South Mount Pleasant (Area 42): The median sales price settled at $934,500 (a 2.9% dip from last year).
Surprisingly, the median home price in North Mount Pleasant is currently higher than in the South by roughly $10,000. For buyers, this signals that the "affordability" driver that once pushed people North is no longer the primary factor—buyers are choosing North Mount Pleasant for the product, lifestyle, and inventory availability, not just the price tag.
The Volume Split: Where are the Buyers?
While prices are similar, transaction activity tells a very different story. The momentum in January 2026 was clearly located North of the Connector.
North Mount Pleasant is Growing
Area 41 saw a surge in activity with 68 closed sales, a robust 17.2% increase over the previous January. This suggests that despite stabilized interest rates (hovering in the low 6% range), demand for homes in the northern corridor remains high and inventory is turning over effectively.
South Mount Pleasant is Cooling
Conversely, Area 42 saw activity taper off. There were only 46 closed sales, a 9.8% decrease compared to the year prior. This lower volume, combined with the slight price dip, suggests a market that is more constrained—likely due to a lack of inventory turnover in these established neighborhoods rather than a lack of buyer demand.
By the Numbers: January 2026 Snapshot
The Takeaway
- For Sellers: If you are selling in North Mount Pleasant, you currently have the upper hand in terms of traffic. Buyers are active, and volume is up nearly 20% year over year. In South Mount Pleasant, patience is key; with lower transaction volume, pricing your home correctly is critical to standing out in a slower-moving market.
- For Buyers: The "discount" for driving further north is gone. You are now paying roughly the same median price on either side of the Connector. Your decision now comes down to lifestyle preference: the established proximity and "legacy" feel of the South versus the active, higher-inventory, and often newer product of the North.
Photo Gallery