April 2026 Charleston Regional Real Estate Market Update: Key County Trends
On the 10th of every month, we analyze the official closed data from the previous month provided by the Charleston Tri-County Regional MLS (CHS Regional MLS).
Welcome to our April 2026 real estate market update for the greater Charleston region. As local real estate professionals who live, work, and navigate this market daily, we know that timing and data accuracy are everything when you are preparing to buy or sell a home.
On the 10th of every month, we analyze the official closed data from the previous month provided by the Charleston Tri-County Regional MLS (CHS Regional MLS). By focusing strictly on single-family residential homes, we can strip away the noise and give you a clear, high-level view of where the market is actually heading across Berkeley, Charleston, and Dorchester counties.
Here is exactly what the latest numbers mean for your equity, your buying power, and your next move.
1. Inventory Breakdown: What’s Actually on the Market?
When we look at Homes for Sale, we see the exact, active inventory that prospective buyers are browsing today. More inventory means more choices for buyers; less inventory means stiffer competition.
In April 2026, we saw highly localized, divergent paths depending on which county you call home:
- Charleston County: Active inventory ticked up slightly by 2.7% year-over-year, bringing the total available properties to 1,521 single-family homes.
- Dorchester County: Buyers found a bit more breathing room here, with inventory rising 5.7% year-over-year to a total of 785 homes for sale.
- Berkeley County: Bucking the trend of its neighbors, Berkeley County saw supply constrict further. Active listings dropped by 3.8%, leaving just 1,072 homes on the market.
The Professional Perspective: While the marginal inventory growth in Charleston and Dorchester counties offers a few more options for buyers, it hasn't been enough to fundamentally shift the power dynamic away from sellers.
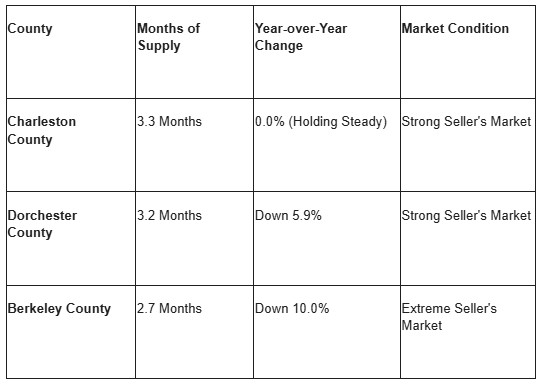
2. Market Velocity: Months of Supply
To measure the true "speed" of the market, we calculate the Months of Supply. This metric shows how long it would take to exhaust the current inventory if no new homes were listed for sale.
- Balanced Market: ~6 months of supply (equal leverage for buyers and sellers).
- Buyer’s Market: Over 6 months of supply (excess inventory, prices soften).
- Seller’s Market: Under 6 months of supply (low inventory, upward pressure on prices).
The April 2026 data shows that the entire tri-county area remains firmly entrenched in a seller's market:
Berkeley County is experiencing the tightest squeeze, with a double-digit percentage drop in supply forcing buyers to act quickly and decisively.
3. Pricing Leverage: Median Percent of Original List Price
Final sales prices tell part of the story, but the Median Percent of Original List Price tells us who holds the negotiation leverage. This metric tracks how close sellers are getting to their original asking price before any price drops or concessions.
Despite persistent macroeconomic factors like elevated mortgage interest rates, demand in the Lowcountry remains resilient. Sellers are still netting nearly full asking price:
- Berkeley County: Sellers are capturing an impressive 99.0% of their original list price—a subtle 0.5% increase from this time last year.
- Dorchester County: Homes are closing at a median of 98.3% of original list price.
- Charleston County: Sellers are locking in 97.6% of their initial asking price.
This proves that buyers accept current pricing structures and are willing to pay top dollar for well-positioned, move-in-ready homes.
The Bottom Line
The April 2026 data confirms a clear reality: The Charleston regional market remains highly competitive. While marginal inventory increases in Charleston and Dorchester counties provide a sliver of relief, strong buyer demand is rapidly absorbing these homes, keeping the velocity high and holding prices firm.
Why You Need a Hyper-Local Strategy
While county-wide data is excellent for identifying macro trends, real estate is fundamentally hyper-local. Market dynamics can shift drastically between a historic home in Downtown Charleston, a suburban neighborhood in Summerville, or new construction in Mount Pleasant. Your specific zip code, neighborhood, price bracket, and home configuration will have its own micro-market data.
Let’s Build Your Custom Report
If you want to know what your home is worth in today’s market, or if you are trying to navigate a purchase in a competitive neighborhood, let us put our localized expertise to work for you.
- Email Us directly: david@charlestonhome.com
- Explore More Resources: Visit www.davidkent.net to search active listings.
Reach out today for a complimentary, hyper-focused market analysis tailored precisely to your specific neighborhood and real estate goals.
Photo Gallery