Shrinking Deals, Rising Value: The Latest Trends in Charleston Real Estate
Charleston Residential Market Pulse: Four-Week Strategic Analysis
April 10 – May 7, 2026
1. Aggregate Market Momentum and Price Trajectory
In the Charleston tri-county real estate landscape, weekly contingent data—properties moving under contract—serves as the primary leading indicator of real-time market health. Over the four-week period ending May 7, 2026, the market demonstrated an extraordinary upward trajectory in pricing power, confirming a seller-dominant regime.
Total market volume remained consistently high, moving from 350 units in the first week to a peak of 399. Most critically, the Single Family Home (SFH) median list price surged by 12.6%—from $497,000 to $560,000 in just 28 days.
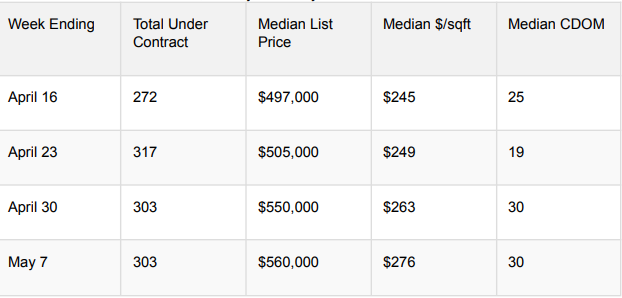
The Strategic "So What?": The rise in CDOM alongside a 12.6% price floor jump suggests that as "attainable" stock is exhausted, the remaining inventory requires slightly longer to clear due to higher capital requirements, not lack of demand.
2. The Luxury Tier: High-End and Ultra-Luxury Performance
The $1M+ segment witnessed a staggering surge in velocity, with homes going under contract rising from 40 units in week one to 71 units by week four. A "flight to quality" peaked in week three with 10 homes priced over $5M moving under contract.
$10.9 Million: Daniel Island (Week 3)
$10.0 Million: Kiawah Island (Week 1)
$8.0 Million: Peninsula Charleston (Week 3)
$7.9 Million: Isle of Palms (Week 4)
$7.8 Million: Mt. Pleasant (Week 1)
The Strategic "So What?": This volume expansion signals a "demand surge" altering the competitive landscape. As ultra-luxury inventory is absorbed, a vacuum is created in the $1M–$2M "entry-luxury" tier.
3. Regional Micro-Market Analysis
Coastal islands saw activity rise from 34 properties in week one to 56 in week four. High premiums in the core have created a "ripple effect" into suburban hubs:
Cane Bay (Berkeley County): Maintained a dominant share of county volume (avg. 12-19 units weekly).
Wescott (Summerville/Ladson): High-activity hub averaging 5-7 units per week.
Carolina Bay (West Ashley): Preferred established corridor in the mid-$500k range.
Park Circle (North Charleston): Steady performer with 3-4 units weekly.
4. Inventory Composition and Market Stability
Distressed assets account for less than 1.5% of the market (2-5 units per week), signaling extreme stability. The "Median Year Built" (2002–2005) indicates the inventory is mature, modern-standard stock with lower CAPEX requirements.
The Strategic "So What?": Near-zero foreclosure rates and consistent new construction point to a fundamentally sound market rather than a speculative bubble.
5. Condo and Townhome Market Dynamics
This sector is now the primary battlefield for entry-level buyers and luxury downsizers. Contract volume holds steady between 64 and 73 units per week.
$300k–$499k: High-volume core.
Under $200k Scarcity: Available units dropped to just 2 per week by May 7.
Luxury Condo Tier: Reached transactions as high as $4.3M.
The Strategic "So What?": The extinction of inventory under $200,000 is redefining the "starter home" in Charleston, forcing entry-level buyers into the $300,000+ bracket.